image of tech solutions demonstration (for a hr tech)

Level up your impact through the power and persuasion of data storytelling.

Data is everywhere. But data alone doesn't move people — stories do.

Finding Stories is a specialist data storytelling and visualisation consultancy, committed to transforming how organisations look at, talk about, and present their data.

From training courses & coaching, through to project delivery & data consultancy, we help teams turn complex data into powerful stories that inspire action.

Our goal is to help you uncover your potential and find your own data story.

As data complexity grows, technology advances and the expectations of everyone working in and around data increases, we're on a mission to get everyone on a level playing field and change how we look at and talk about our data.

Through a mixture of training and consultancy, our goal is to help individuals and teams strengthen their data storytelling capabilities and thrive as leaders within their organisations.

image of tech solutions demonstration (for a hr tech)

What training courses do we offer?

1. Problem Solving

Modern workspace with a large network diagram displayed on a wall-mounted screen, flanked by plants and lit by sunlight.

Solving Problems with Data.

A training course designed to help teams and individuals start projects with the right focus and intention.

  • Key features

  • How to write effective Problem Statements.

  • How to Disaggregate problems into analysable sections.

  • How to Prioritise your Problem Solving efforts.

2. Data Visualisation

Introduction to Data Visualisation

A training course designed for those less confident in Data and Data Visualisation.

  • Key features

  • An explanation of what is Data Visualisation.

  • A walkthrough and practice of all key data chart types.

  • Key principles on how to maximise the persuasive power of your visuals.

Grid of ten colored blocks showing different chart types: vertical bar, horizontal bar, line chart, slope chart, scatter plot, bubble chart, pie chart, stacked bar, area chart, and histogram.

Design Better Charts

A training course designed for those that are confident in Data Visualisation, but want to take their charts to the 'next level'.

  • Key features

  • A review of what makes a Great Chart.

  • A thorough exploration of three key principles of Data Visualisation Design.

  • An introduction to a 4 stage process to creating your own visualisations.

Modern office corner with an orange swivel chair, a whiteboard with an orange bar chart, a plant, and woven poufs on a brown rug.

3. Data Storytelling

Write Better Data Stories

A training course designed for those who want to improve how they structure and tell their data stories to help them land with greater impact and emotion.

  • Key features

  • How to more effectively start your presentation write-ups through Storyboarding.

  • A walkthrough of three core ideas on how to Elevate your content to drive greater engagement and buy-in.

  • Advice on how to end your presentation and utilise Behavioural Economics to Nudge your stakeholders into action.

Five people seated around a table in a creative workspace, discussing with papers and colourful sticky notes on the table and whiteboard.

Presenting Data with Confidence

A training course designed for those who want to increase their confidence when standing up in front of others to present their data stories.

  • Key features

  • How to effectively plan and prepare for your presentation to maximise your chances of success.

  • A review of the importance of rehearsing and how to do it.

  • Advice on dealing with pre-presentation nerves and how to best engage with your audience during and after the presentation.

Two people in a meeting reviewing a data visualisation dashboard on a screen

Why should you choose Finding Stories?

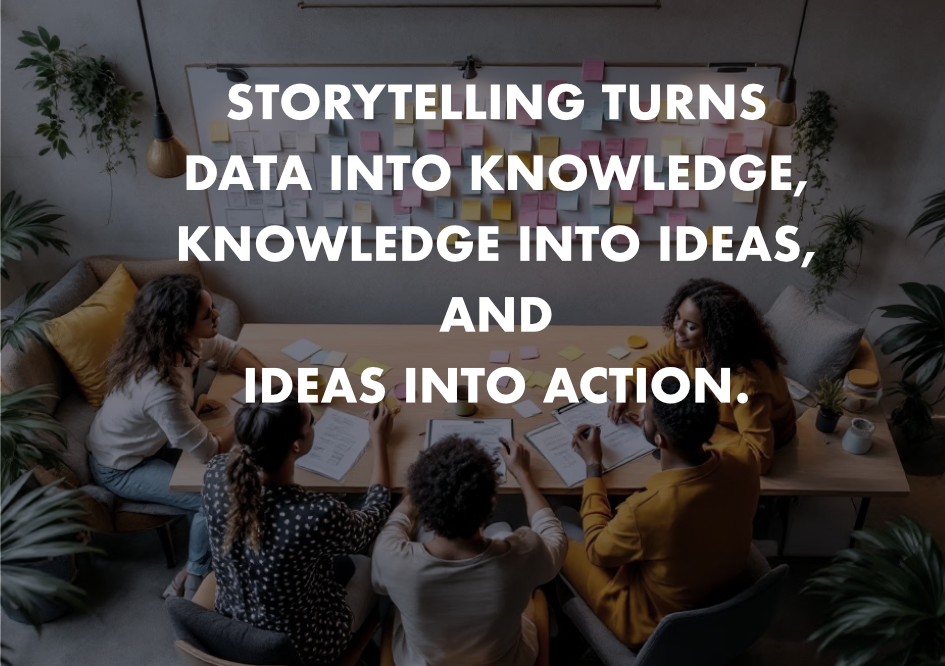
At Finding Stories, we believe that data has the power to inspire, persuade and drive real change — but only when it's communicated with clarity, confidence and conviction.

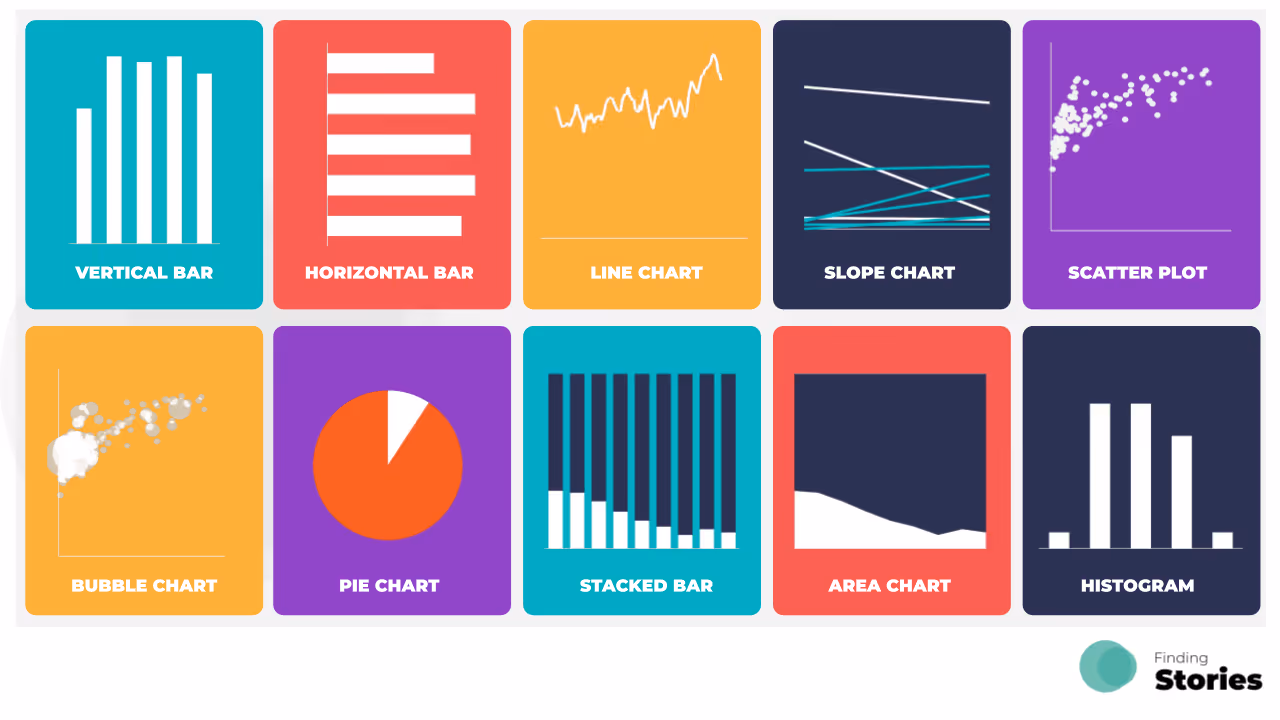
We're a specialist data storytelling and visualisation business. From training and coaching through to consultancy and project delivery, we're built on a simple but powerful idea: that the best results come when deep data expertise, commercial insight and the art of powerful communication come together.

Meet The Team:

Ross Durston wearing sunglasses, white t-shirt, and pink shorts sitting on stone steps of an ancient amphitheater under a clear blue sky.

Ross Durston, Co-Founder & Chief Data and Storytelling Officer.

With 20+ years in data analytics, business intelligence and data storytelling, Ross is on a mission to help individuals and teams communicate their data with confidence and impact.

Sarah Durston, Co-Founder & Chief Operations and Development Officer.

With 15+ years of commercial and operational expertise at some of the UK's most recognised businesses, Sarah brings the commercial depth and partnership approach that turns great training into real organisational change.

Mathew David, Finding Stories Associate.

An award-winning actor, writer and director, Mathew brings the storytelling artistry and performance expertise of a filmmaker to the way your teams communicate and present — with results that are genuinely transformative.

Latest insights

Blog

Explore quick insights on data storytelling and design to ignite your next idea.

Finding My Story: The One with a Podcast
Data Storytelling
40 min watch
At the start of the year, I was presented with an opportunity to take part in a Podcast to help explain what is Data Storytelling, why it's important and why is it personal to me. This is my story.
What is Data Storytelling?
Data Storytelling
5 min read
Data storytelling is a term that’s widely used — but often poorly defined. At Finding Stories, it sits at the core of everything we do, because strong data storytelling is what turns analysis into impact. So what is data storytelling, really?
How to stay calm before presenting your data story?
Presentation Skills
3 min read
How can you stay calm and centred ahead of your next data storytelling presentation.