Resources | Chart Generators
Although they tend to be our 'go-to' resource when creating data visualisations, there's more to the data visualisation world than simply Excel, Google Sheets and Power BI. There's a world of great tools out there to help you tell your next data story. Here are some of our recommendations that you may not have come across.
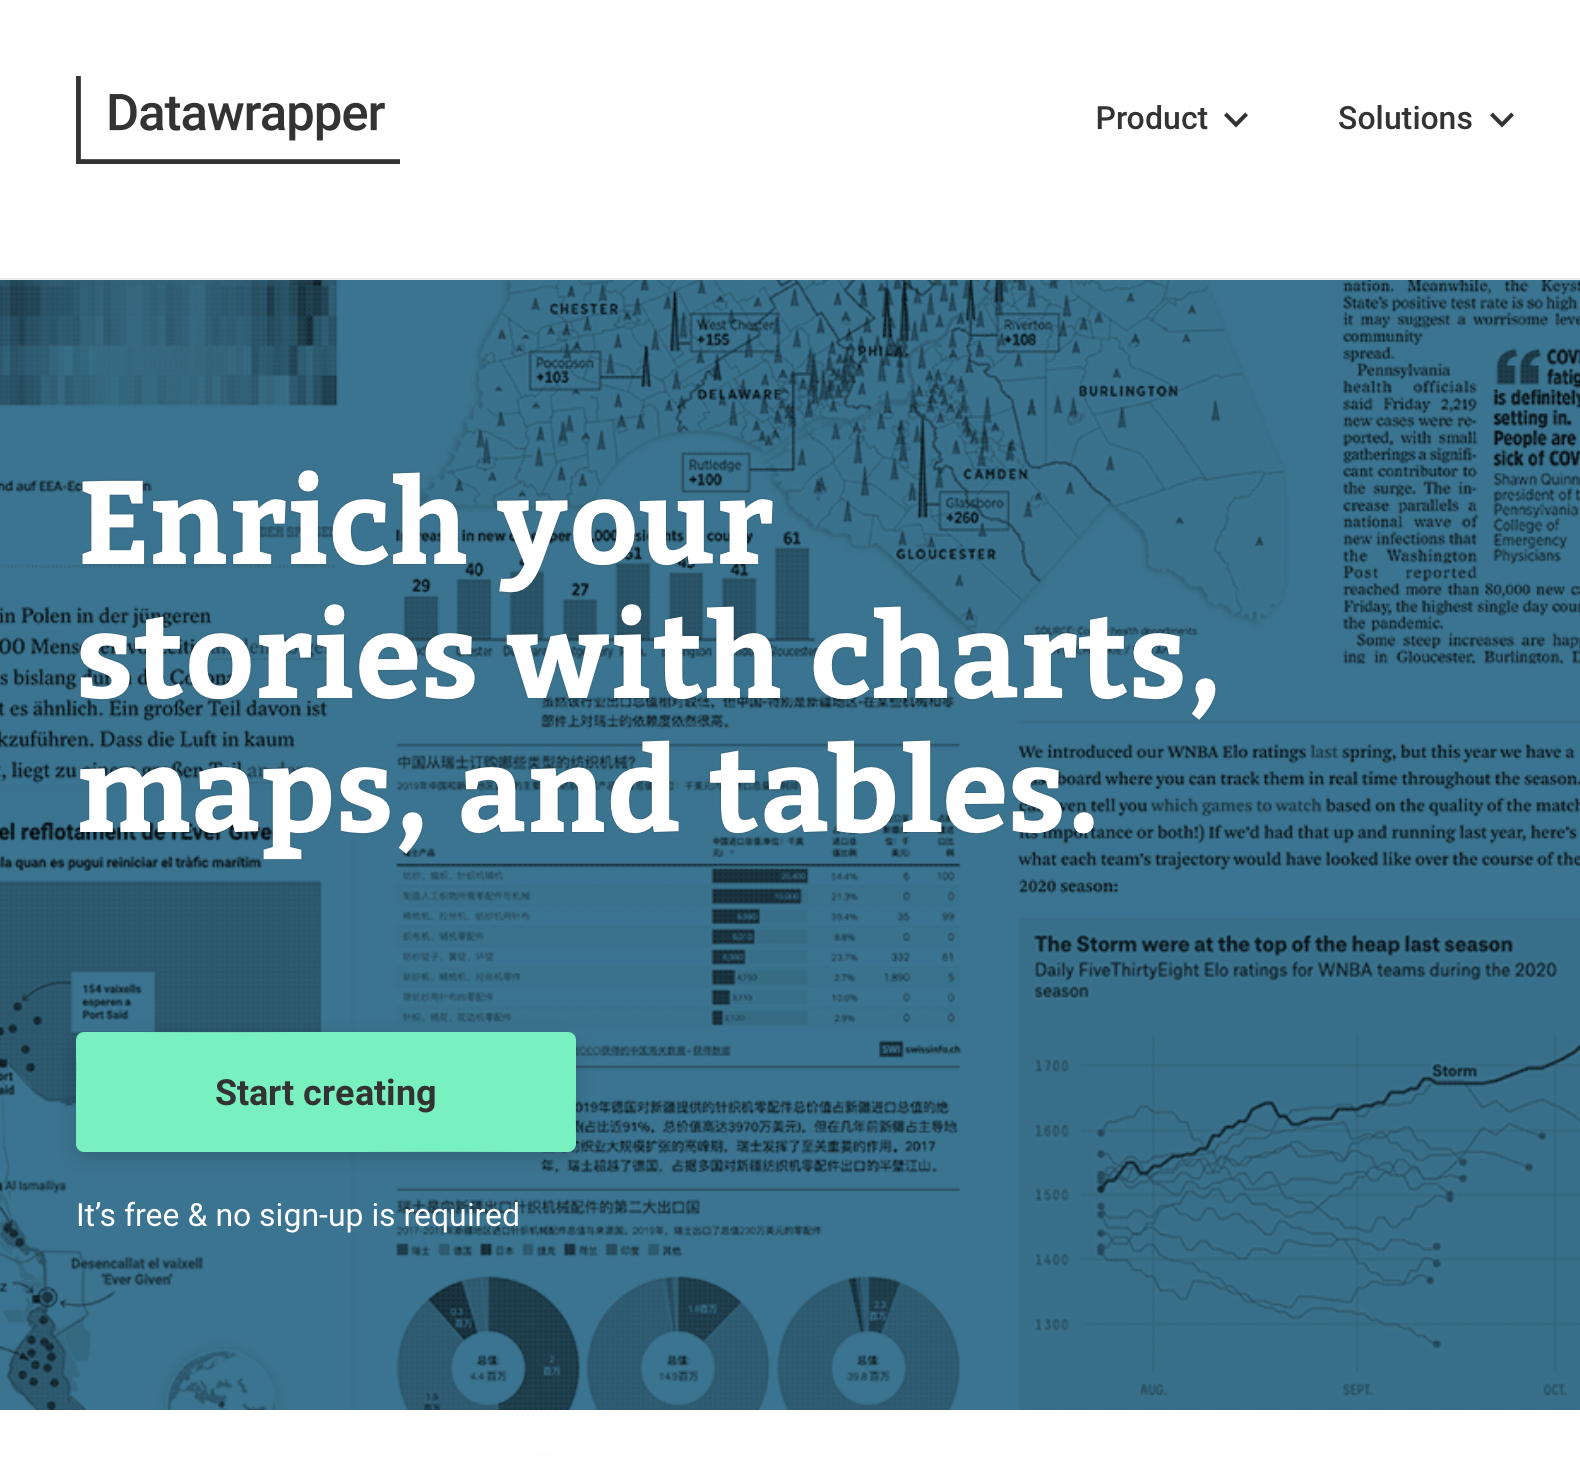
1. Datawrapper
Enrich your stories with charts, maps and tables.
A free online chart generator that is easy to use and creates high quality outputs ready to be inputted straight into your next data story. Trusted by multiple news outlets as their go to tools when telling data stories.
www.datawrapper.de
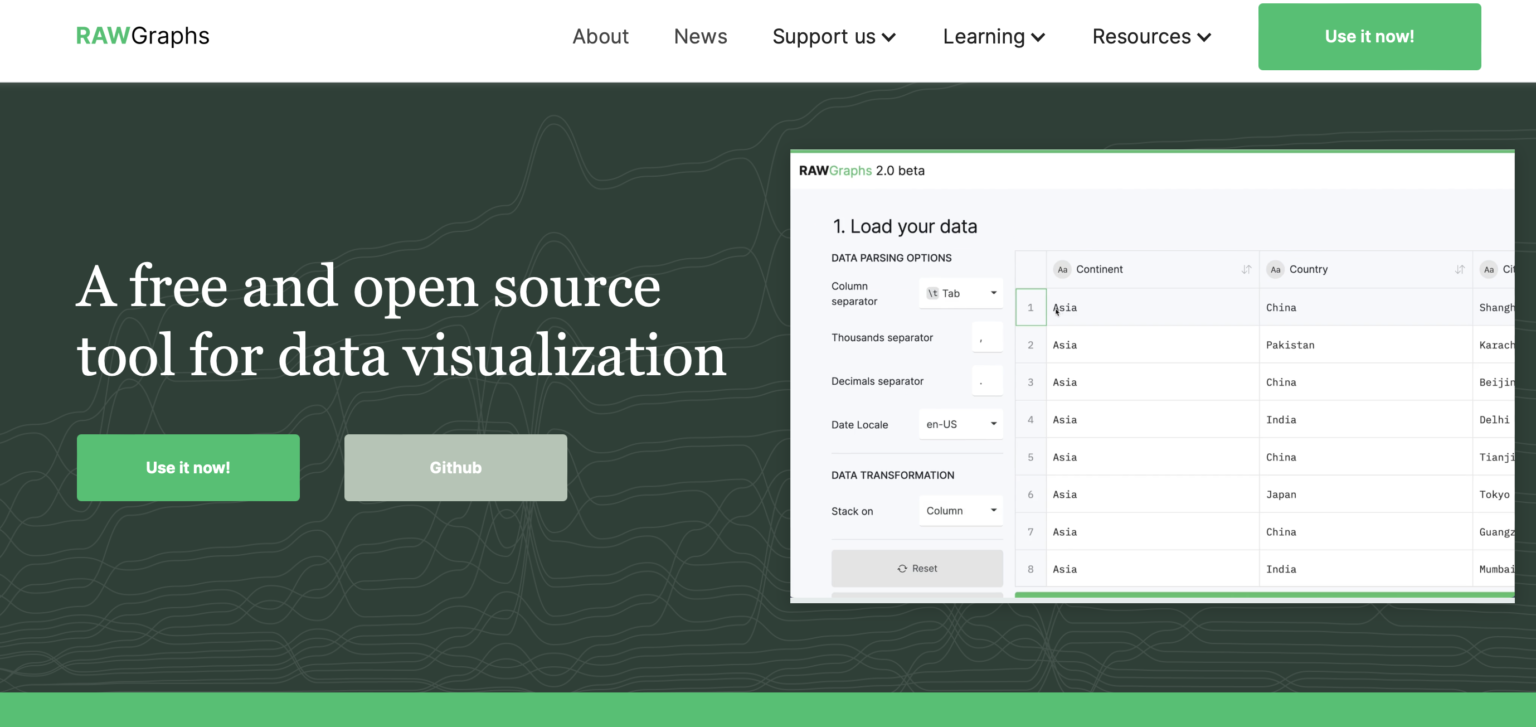
2. Raw Graphs
A free and open source tool for data visualisation.
My go-to online chart creator when I want to create a .svg output ready for Adobe Illustrator / Affinity Designer.
www.rawgraphs.io